base
http://www.statmethods.net/graphs/
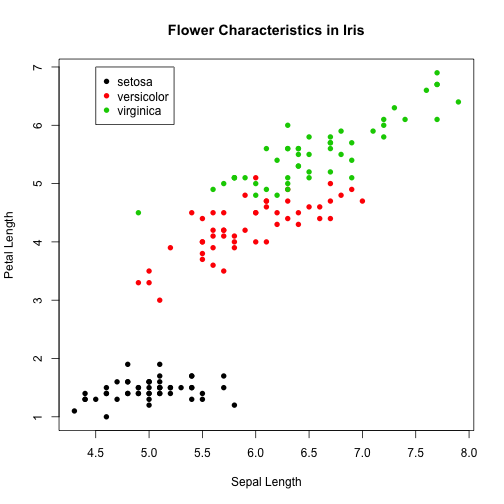
plot(iris$Sepal.Length, iris$Petal.Length,        # x variable, y variable
     col = iris$Species,                          # colour by species
     pch = 16,                                    # type of point to use
     cex = 1,                                     # size of point to use
     xlab = "Sepal Length",                       # x axis label
     ylab = "Petal Length",                       # y axis label
     main = "Flower Characteristics in Iris")     # plot title

legend (x = 4.5, y = 7, legend = levels(iris$Species), col = c(1:3), pch = 16)
ggplot2
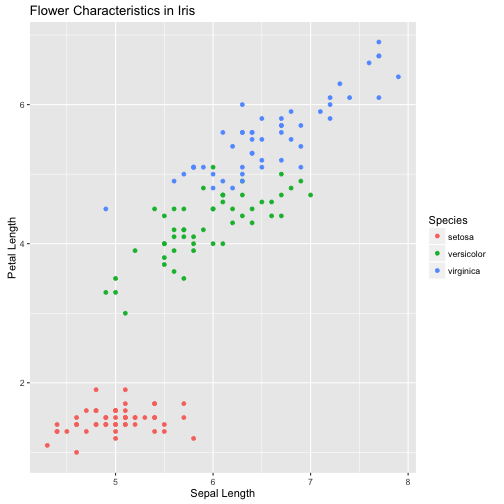
library(ggplot2)
gg <- ggplot(iris) +
      geom_point(aes(x=Sepal.Length, y=Petal.Length, color = Species)) +
      labs(title = "Flower Characteristics in Iris", x = "Sepal Length", y = "Petal Length")
gg
ggvis
library(ggvis)
data(iris)

# hack for title from: http://stackoverflow.com/questions/25018598/add-a-plot-title-to-ggvis
add_title <- function(vis, ..., x_lab = "X units", title = "Plot Title") {
  add_axis(vis, "x", title = x_lab) %>%
    add_axis("x", orient = "top", ticks = 0, title = title,
             properties = axis_props(
               axis = list(stroke = "white"),
               labels = list(fontSize = 0)
             ), ...)
}

p <- ggvis(iris, x = ~Sepal.Length, y = ~Petal.Length, fill = ~Species) %>% add_title(title = "Flower Characteristics in Iris",
                                                                                      x_lab = "Sepal.Length")
layer_points(p)
googleVis
https://github.com/mages/googleVis#googlevis
suppressPackageStartupMessages(library(googleVis))
op <- options(gvis.plot.tag = "chart")
options(op)

iris2 = iris[, c("Sepal.Length", "Petal.Length")]
i <- sapply(iris2, is.factor)
iris2[i] <- lapply(iris2[i], as.character)
flower <- gvisScatterChart(iris2, options = list(title = "Flower Characteristics in Iris"))
# plot(flower)
print(flower, "chart")
rCharts
library(rCharts)
names(iris) = gsub("\\.", "", names(iris))
rPlot(PetalLength ~ SepalLength , data = iris, color = 'Species', type = 'point')
## Error in myChart$copy(): could not find function "new"
plotly
library(plotly)
data(iris)
plot_ly(iris, x = Sepal.Length, y = Petal.Length, color = Species, mode = "markers") %>%
  layout(title = "Flower Characteristics in Iris")
## Error in file(con, "rb"): cannot open the connection
ggplotly
p <- ggplot(iris) +
      geom_point(aes(x=Sepal.Length, y=Petal.Length, color = Species)) +
      labs(title = "Flower Characteristics in Iris")

ggplotly(p)
## Error in file(con, "rb"): cannot open the connection