Tips & Methodology
- Spatial analysis or spatial statistics includes any of the formal techniques which study entities using their topological, geometric, or geographic properties.
-
R has some robust tools and some of which are dynamic and incorporate web-based tech. Here are some of those tools:
- leaflet: open-source, interactive JavaScript-based map. Leaflet is great and makes good use of the pipe (
%>%) bymagrittr. Leaflet works great in RStudio and Shiny. It generates a HTML file for sharing via email!
library(leaflet)
m <- leaflet() %>%
  addProviderTiles("CartoDB.Positron")  %>%
  addMarkers(lat=45.523452, lng=-122.67620, popup="Portland, OR")

m  # Print the map
## Error in file(con, "rb"): cannot open the connection
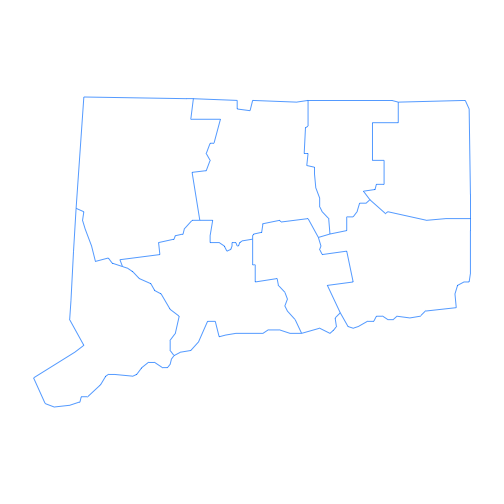
- maps: Draw Geographical Maps based on a database collecion of data.
library(maps)
map('county', 'connecticut', col = "dodgerblue")
- ggmap: A collection of functions to visualize spatial data and models on top of static maps from various online sources (e.g Google Maps and Stamen Maps). It includes tools common to those tasks, including functions for geolocation and routing. This package has a great function called
geocode()in which you supply the location (i.e. an address as the location argument) and the latitude and longitude values are returned - this can be computationally exhaustive depending on how many address are needed to be geocoded. - rMaps: rMaps is an R package to create, customize and publish interactive maps from R. It supports multiple mapping libraries, including leaflet, datamaps and crosslet.
- ggplot2, geom_map
# Better example
library(ggplot2)
crimes <- data.frame(state = tolower(rownames(USArrests)), USArrests)
crimesm <- reshape2::melt(crimes, id = 1)
if (require(maps)) {
states_map <- map_data("state")
ggplot(crimes, aes(map_id = state)) +
geom_map(aes(fill = Murder), map = states_map) +
expand_limits(x = states_map$long, y = states_map$lat)
last_plot() + coord_map()
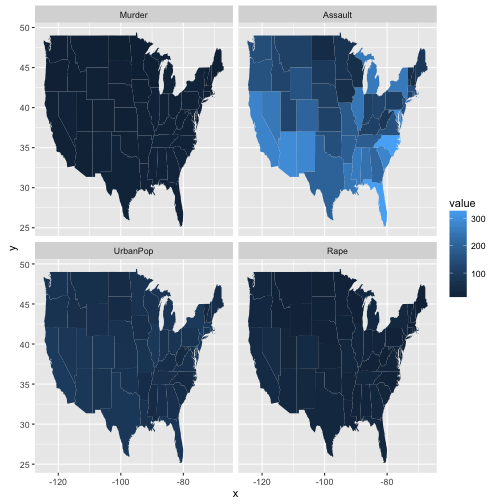
ggplot(crimesm, aes(map_id = state)) +
geom_map(aes(fill = value), map = states_map) +
expand_limits(x = states_map$long, y = states_map$lat) +
facet_wrap( ~ variable)
}